The OEE KPI and its Meaning

Overall Equipment Effectiveness (OEE) is a KPI that describes the availability of the plant in relation to the production time and thereby puts the degree of utilization, performance and quality into an easily ascertainable relationship. Today, it is the standard for manufacturing companies to make problems easily visible by visualizing equipment availability. This allows defects to be identified more quickly and appropriate optimization measures to be initiated. The following will explain what exactly is measured with OEE, how OEE is calculated, which major problems negatively affect OEE and why OEE is such an important metric for companies that want to optimize their plant utilization.
From Breakdown Management to Total Productive Maintenance System
The concept of Overall Equipment Effectiveness was first described by Seiichi Nakajima in 1982. With the Total Productive Maintenance System, he found a method with which companies could systematically identify gaps and optimization potential and thus reduce production costs. In doing so, he met a need that had been developing since the 1960s.
The production processes of large companies were becoming increasingly complex, making it necessary to move away from classic Breakdown Management. Breakdown management meant that when a machine broke down, it was repaired.
This had evolved into Productivity Management, in which production teams were directly involved in maintenance and repair. This allowed companies to begin to address the increasing complexity of equipment and maintenance tasks and achieve higher overall plant availability. At the same time, however, it was also more difficult to put equipment availability in relation to your conditions and thus discover deficiencies and optimization potential.
This is what the Overall Equipment Efficiency metric enables.
OEE Definition
The initial question regarding OEE is: How much time was a plant actually in operation? Or to put it another way: How productive was a plant in real terms in relation to its operating time? How many good units could be produced during this time?
Overall Equipment Effectiveness (OEE) is a KPI with which you can measure manufacturing productivity or the availability of a plant.
An OEE value of 100 % means that you are producing only good units, as fast as possible and without stop times. An OEE value of 0% would mean that at least one of the three dimensions is at 0%. Either only scrap is produced, or the plant is at a standstill.
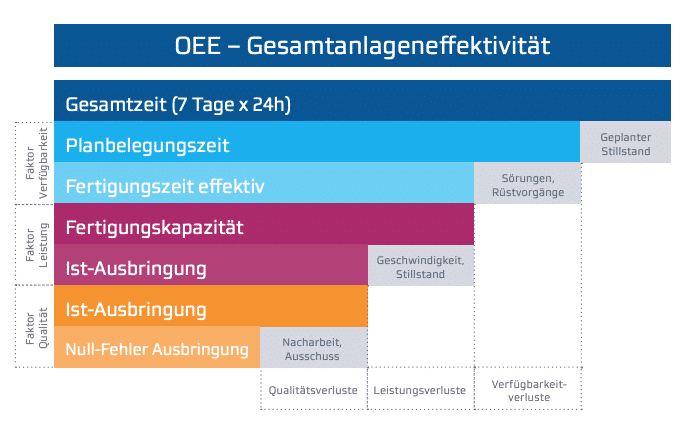
The three factors of Overall Equipment Effectiveness (OEE) calculation
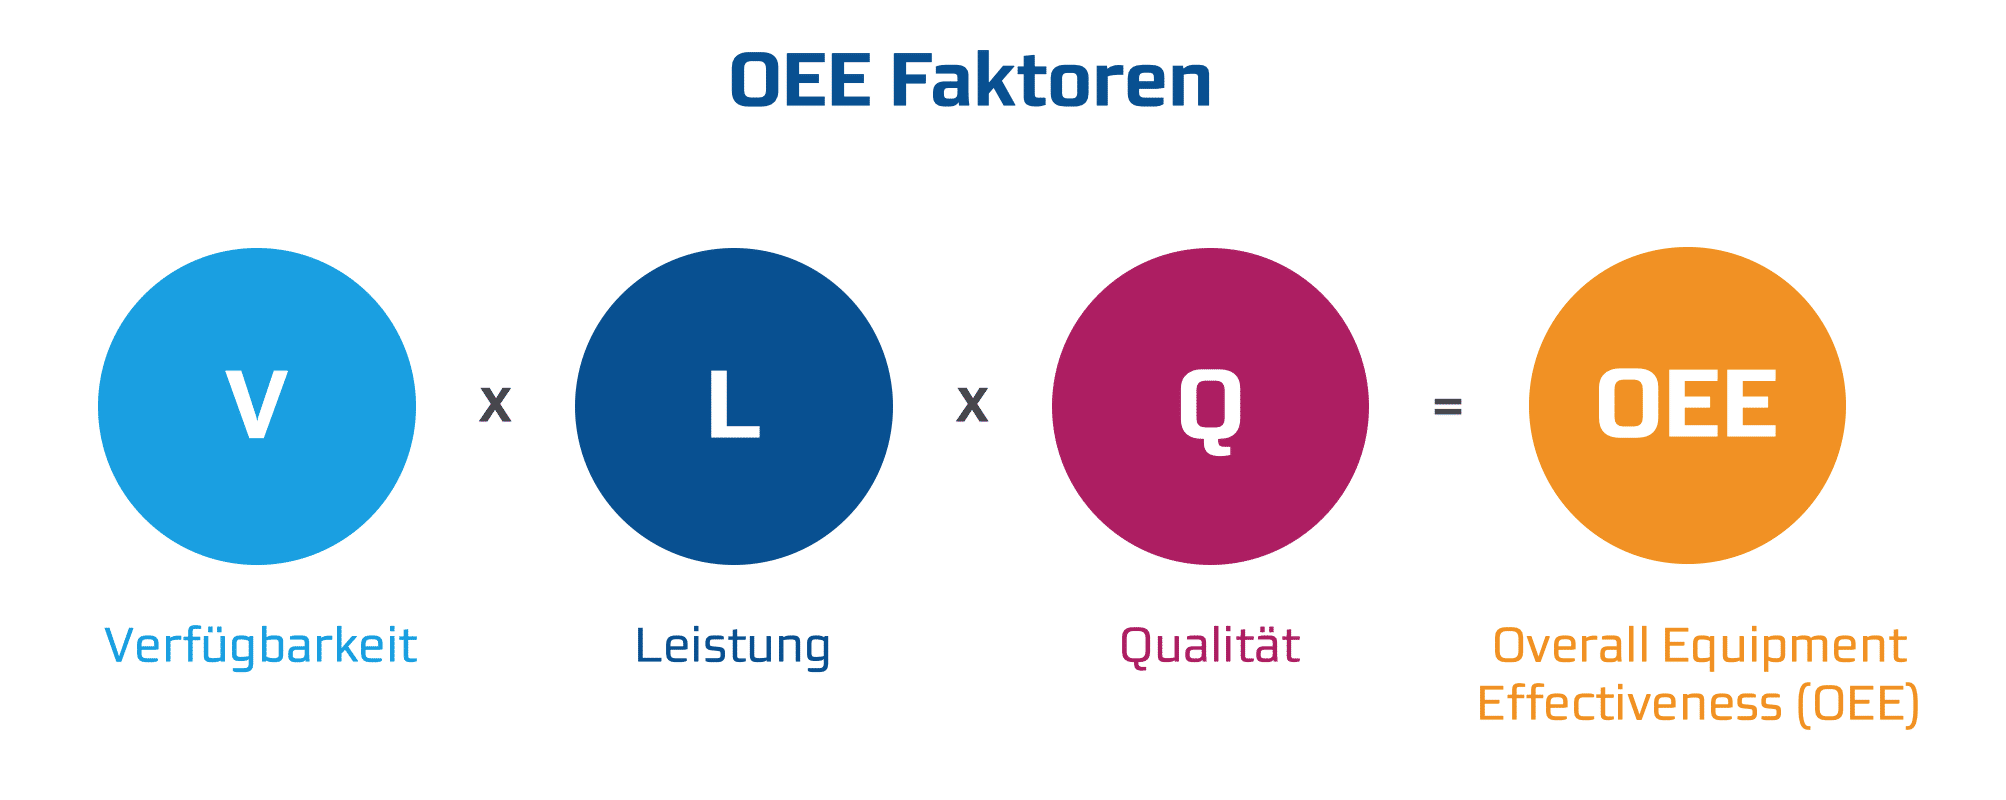
The OEE considers three factors of the plant availability in relation to each other: availability factor, performance factor and quality factor.
Within these dimensions, the problems that end up negatively affecting OEE also play out. They are known as the Six Big Losses.
The OEE calculation:
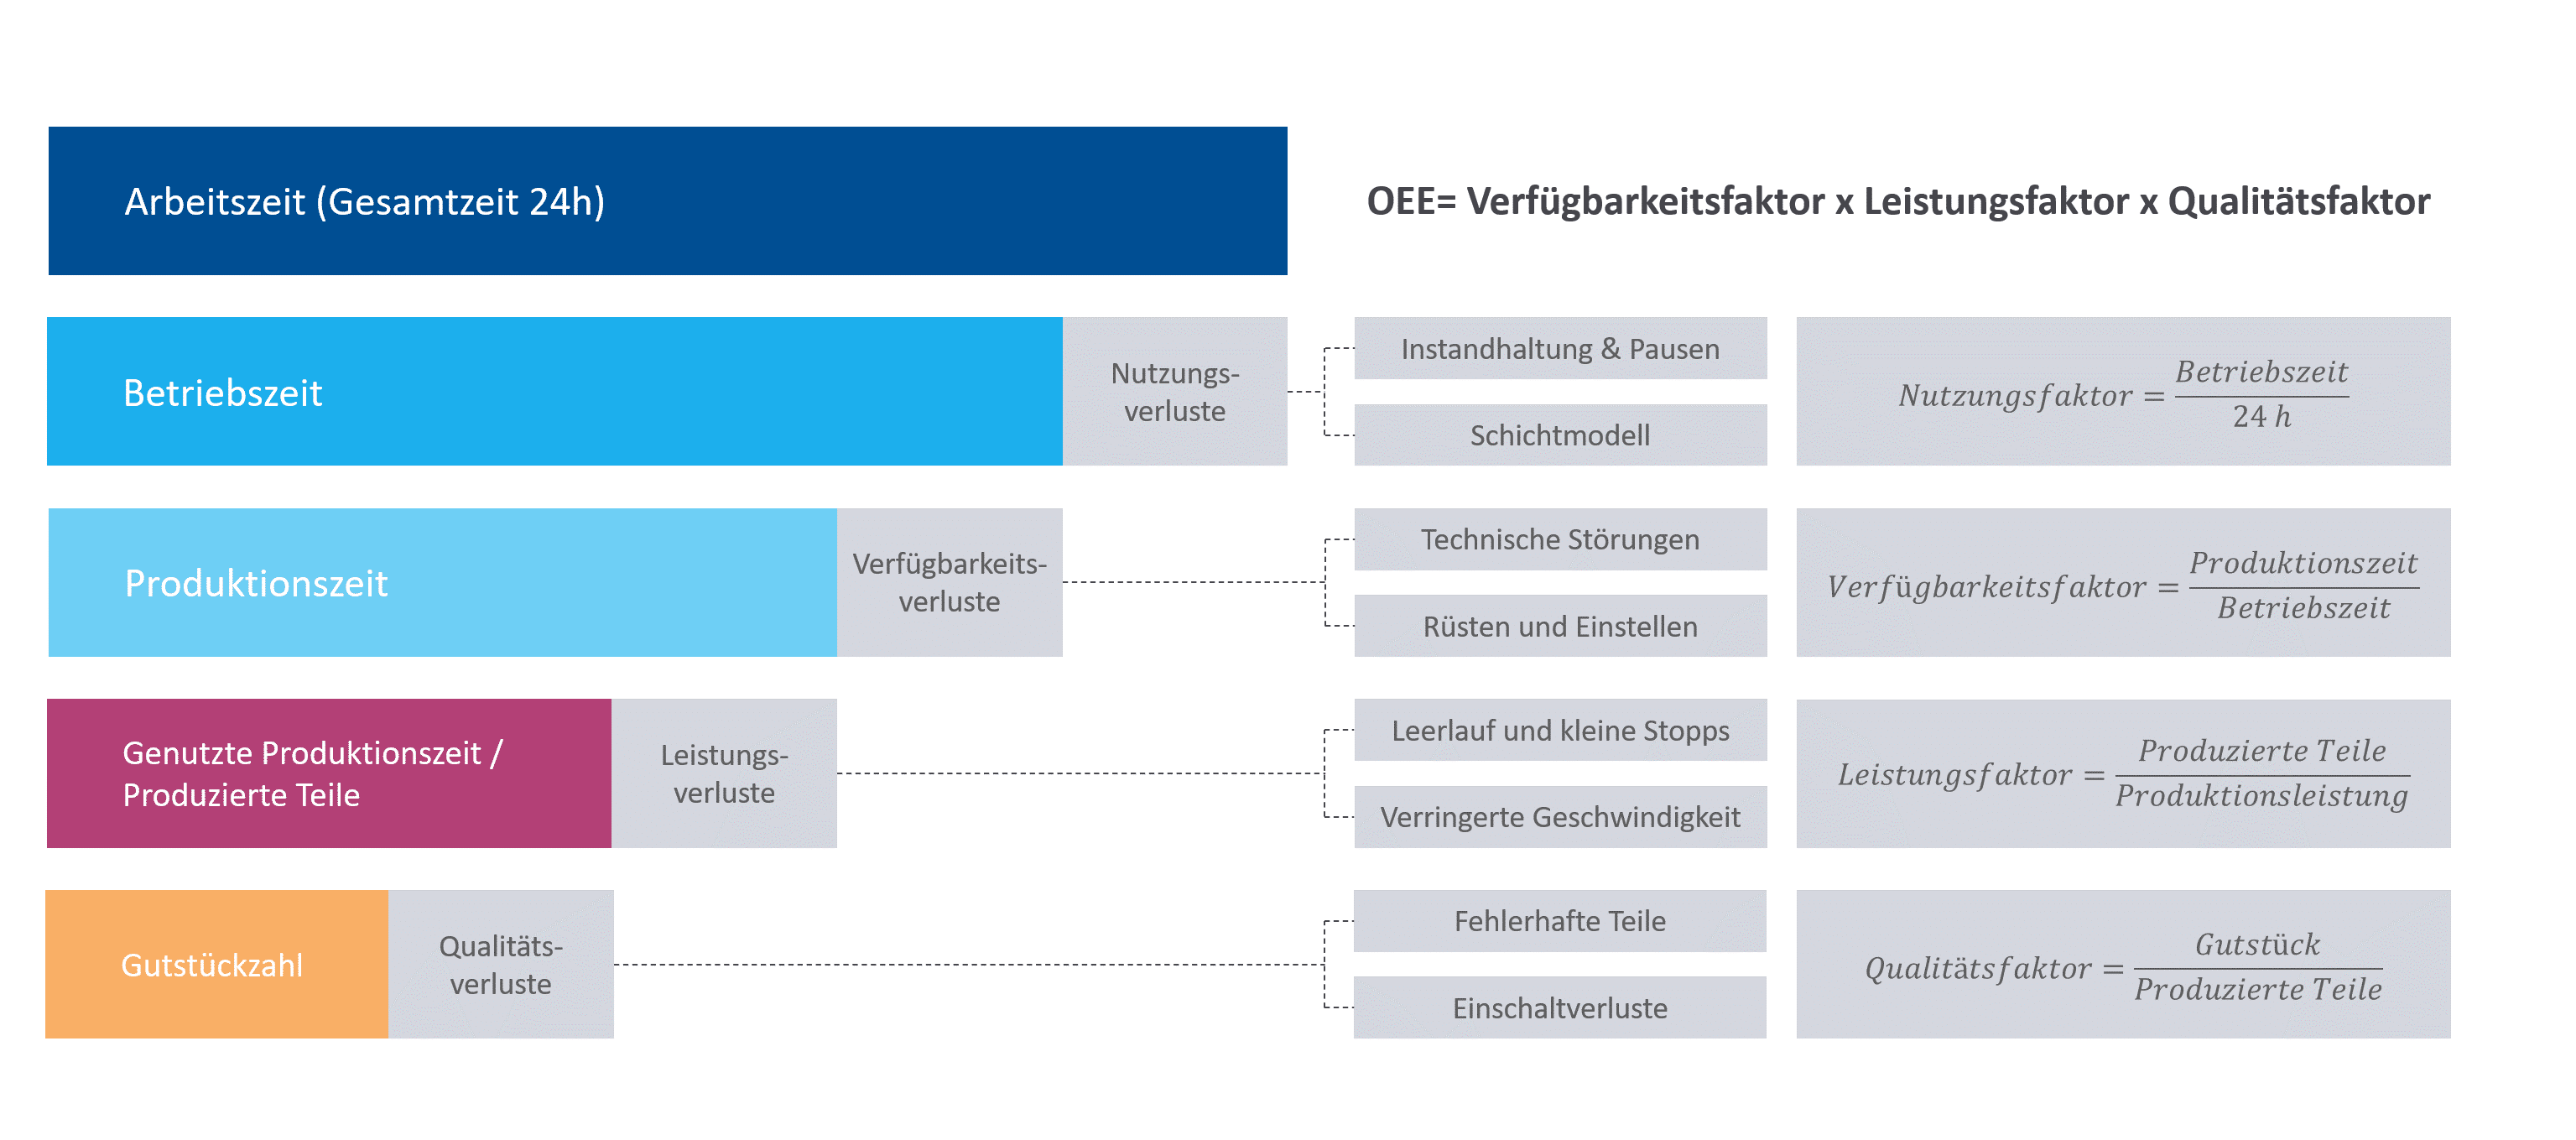
OEE= Availability Factor (%) x Performance Factor (%) x Quality Factor (%).
- Availability factor (%) = uptime / available time
- Performance factor (%) = Total production / (target production rate x operating time)
- Quality factor (%) = Good production / total production
Good OEE values are 80% and above. Through OEE calculation and visualization, it becomes possible to identify sources of loss and optimize bottleneck machines. Non-optimized machines, which usually only have a value of 60 %, can thus be improved.
Availability factor
The first important dimension of Overall Equipment Efficiency is the availability factor of the plant. This results from the ratio of the planned production time to the actual operating time. After all, the operating time of a plant is never identical to the production time. Two major problems have a negative impact on the availability factor.
A plant outage is a period of time during which production should actually be taking place, but the plant is not running due to a fault. This includes unplanned downtime for maintenance, technical malfunctions, breakdowns, or acute lack of personnel to operate the machine.
Set-up times are the times when machines have to be set up or changed over. This includes, for example, the conversion or adjustment of individual parts, but also necessary cleaning work. The operating time on the one hand is therefore offset by various operating states in which the plant is not running. We have to deduct these from the total operating time. If we include all these factors, we have the first key figure: the availability factor of a plant.
Availability factor = running time / planned production time
If the availability factor is 100%, it means that the plant is in operation every minute of the planned production time. An availability factor of 0% would mean a complete plant shutdown for the entire production time.
Performance factor
However, we cannot stop at this dimension in reality, because the speed of a plant is not necessarily linear. There are various reasons why planned and real plant performance diverge:
Small stops and idling are periods when a plant has to stop for a short time. They are power losses that can occur, for example, because of misfeeds, incorrect settings, or jams. Idling is one of the problems that often occurs continuously in manufacturing plants and at the same time goes unnoticed.
Reduced speed is the time when the equipment is running below the fastest possible speed. Reasons for this loss of performance are broad and range from wear and tear of equipment parts to poor employees in equipment operation or material approach.
The performance ratio expresses the ratio of theoretically possible running time and the real running time. It gives us the piece time.
Performance factor= net running time / running time
100% performance means that the production process runs at its theoretical maximum speed without interruptions and setup time.
Quality factor
The third dimension of manufacturing productivity involves the result of the production. Only if the plant produces a saleable unit as an end product, can it be considered to have worked productively. This means that the parts that can no longer be used or have to be reworked are deducted from the total number of parts produced. This scrap is caused by two main problems.
Process errors: In a production there are always defective parts that either have to be reworked or are no longer usable at all. This scrap during production occurs, for example, due to operator errors or incorrect manufacturing equipment settings.
Reduced yield: Reduced yield refers to the scrap that already occurs due to problems before steady-state production. Often the problem occurs after equipment changeover, but also due to warm-up cycles or waste produced by the equipment after start-up.
Quality factor = number of usable parts / number of total parts produced.
100% quality would mean that there are no scrap parts or parts that need to be reworked, while a quality factor of 0% implies completely unusable part production. For the purpose of calculating OEE, parts that need to be reworked are to be treated as rejects. Finally, time is lost in relation to the plant.

Calculate the OEE of multiple machines
A plant usually operates not only one machine, but several.
In our experience, it is still very common to add up the OEEs of individual machines and then calculate an average. This calculation does not work, however, because the conditions under which the individual OEE ratios come about are different. If an average of these OEE figures is calculated, no meaningful statement can be made about any of the individual machines or about the plant as a whole.
The OEE expresses a ratio of several dimensions. If you want to calculate the OEE of several machines for a plant, you have to add up all the individual dimensions and then calculate an overall OEE.
Calculating the Overall Equipment Effectiveness of a production line
Calculating the OEE figure is only seemingly more complicated when it comes to a production line in which individual machines are dependent on each other and have to maintain each other in the production process. This is because the OEE helps you identify the elements in production that reduce your plant availability. Therefore, in production lines, basically only the performance-determining component is relevant.
TEEP vs OEE
TEEP stands for Total Effective Equipment Performance and describes the same relationship as OEE, but related to a calendar year instead of uptime. So to calculate TEEP, you need to relate uptime to the calendar year. A TEEP of 100% would be a fully utilized production facility producing only usable parts at maximum speed 24 hours, 7 days per week.
Assuming a 5 day week with 24 hours of operation, this gives a utilization rate of 71.4% over the year. Multiply this utilization by the OEE to get the TEEP.
TEEP = utilization x OEE
The bottleneck resources are continuously identified and optimized via a control loop. First, the TEEP metric must be measured before a root cause analysis can be performed. Once the cause is identified, the potential is evaluated. How much time and cost must be invested and what benefits can be achieved is then revealed.
When the decision is made to start the project, a project plan is created with the measures, deadlines and responsible parties. In this way, the control loop supports the change management process.
Overall Equipment Effectiveness OEE: Conclusion
Today, OEE is the KPI with which companies can quickly and easily visualize the availability of production equipment. It allows problems to be identified quickly and the success of optimization measures to be assessed.
Q&A – OEE
OEE – Case Study
In our free case study, we look at Productivity 4.0 and how efficiency can be increased with smart technology. You will learn more about the key figure OEE and its importance.
Do you want to know more about this topic or our products?
We will be happy to answer any open questions.